
How Big Is the Carbon Footprint of the Average WordPress Site?
Short, honest answer: small per view, big in aggregate. A single WordPress page view often lands somewhere between ~0.2–0.6 grams of CO₂e under common assumptions—less if you’ve trimmed weight and sit on clean electricity, more if your pages are heavy or you self-host video. Multiplied by tens or hundreds of thousands of views, it adds up. And yes, WordPress sites tend to be heavier than the web median, which nudges that number upward unless you tidy your stack.
Let me explain the moving parts, then we’ll run the numbers in plain English.
When someone loads a page, energy is consumed across:
- Networks (mobile/ISP backbones and edges),
- Data centers/servers (your host + any CDNs/services), and
- User devices (phones, laptops, TVs).
Each kilowatt-hour (kWh) used has an associated carbon intensity (grams of CO₂e per kWh), which depends on the grid mix. Estimation models multiply data transferred by assumed energy per GB and a carbon intensity factor, then (sometimes) add a slice for device energy. The most widely cited public methodology today is the Sustainable Web Design Model (SWDM), used by tools like the Website Carbon Calculator.
How to estimate a WordPress site’s footprint:
1) The “simple average” way (fast ballpark)
Website Carbon’s current public splash stat says: the average web page ≈ 0.36 g CO₂e per pageview. Handy for quick back-of-the-napkin math. If your WordPress pages are lighter than average, you’ll be lower; if they’re heavier (and many are), you’ll be higher.
2) The model-based way (still simple; more tailored)
Take your page weight (the transferred MB per view) and run it through a model based on recent internet energy + carbon-intensity assumptions (that’s what Website Carbon/SWDM do under the hood). This is better for WordPress because you can plug in your actual page weight (and even your hosting/DC cleanliness if you know it). The latest SWDM update refreshed the energy and data-transfer inputs in 2024 to reflect a more efficient internet per GB (and a much bigger total data volume), so modern results are generally lower per MB than a few years ago.
Either path works. I’ll show both.
What the data says about page weight in 2025
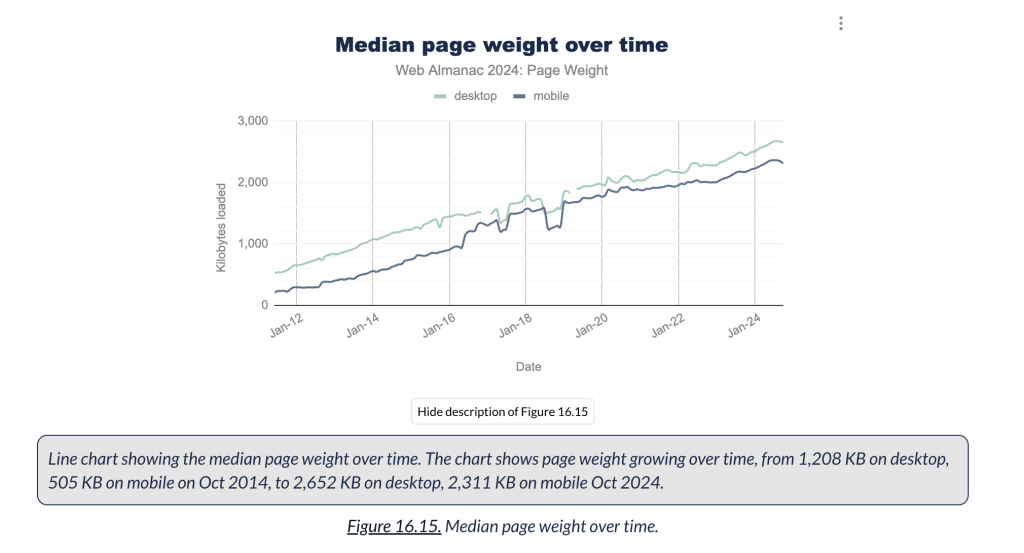
Real-world telemetry from the HTTP Archive / Web Almanac places the median desktop page at ~2.65 MB and median mobile at ~2.31 MB as of late 2024/early 2025. That trendline keeps rising—roughly 8% year-over-year, thanks mostly to images and JavaScript.
Now the important bit for WordPress folks: the Web Almanac’s Sustainability chapter breaks out CMS medians and shows WordPress pages are heavier than the overall median—around ~2.97 MB desktop and ~2.68 MB mobile in the latest published figures. That extra weight pushes emissions per view up if all else is equal.
You know what? That’s not a reason to panic. It’s a reason to measure your own pages and trim what doesn’t serve users.
A copy-and-paste way to estimate your WordPress site’s CO₂e
If you want a single “good enough” line you can paste into a doc:
Per-view CO₂e (grams) ≈ 0.36 g × (Your page weight / 2.5 MB)
(Using Website Carbon’s 0.36 g average and the ~2.5 MB web median as a reference.)
For monthly totals:
Monthly CO₂e (kg) ≈ Per-view grams × Monthly pageviews ÷ 1000
If you want to be a touch more rigorous (still simple), measure your page weight in DevTools or WebPageTest and feed it into SWDM-based tools (Website Carbon v4 or similar). That’s the route many agencies take for reporting.
Worked examples (so the math feels real)
Let’s apply that quick formula with realistic WordPress sizes and ordinary traffic. I’ll assume 2.97 MB for a “typical” WP desktop weight from the Web Almanac and scale off the 0.36 g average:
- Small blog (10,000 monthly pageviews; 2.5 MB/page)
Per view ≈ 0.36 g; Monthly ≈ 3.6 kg CO₂e. - Typical WP brochure site (25,000 views; 2.97 MB/page)
Per view ≈ 0.36 × (2.97/2.5) ≈ 0.43 g; Monthly ≈ 10.8 kg. - Content site / magazine (150,000 views; 3.5 MB/page)
Per view ≈ 0.36 × (3.5/2.5) ≈ 0.50 g; Monthly ≈ 75 kg. - WooCommerce store (300,000 views; 3.0 MB/page)
Per view ≈ 0.43 g; Monthly ≈ 129 kg.
If you self-host video (don’t) or ship 5–10 MB pages (also don’t), the per-view number climbs quickly. Conversely, many well-tuned sites now test in the 0.05–0.15 g range per view with efficient hosting, a CDN, and lean pages—agencies publicly publish their page-level stats to prove it.
One caution: different calculators produce different numbers because their energy/GB and grid assumptions differ. This is normal; treat the result as an estimate, watch the trend over time, and compare against your own baselines rather than someone else’s marketing deck. The DebugBear team has a good explainer on why tools disagree.
Where the grams actually come from
If you want to cut emissions, chase the big rocks:
- Data transfer (page weight × traffic) — still the main lever; less data means less energy in networks and data centers. HTTP Archive shows images and JS dominate.
- Electricity mix — same bytes, different carbon if your host/CDN runs on cleaner power. SWDM v4 lets tools factor cleaner grids into the result.
- Device energy — complex pages and heavy scripts make devices work harder. Recent research also puts the user-side share in context of total digital life (web, social, streaming, calls) — it’s not trivial.
Add the three together, and you’ve got your footprint per view.
Why WordPress pages skew heavier (and what to do about it)
WordPress is flexible. With flexibility comes bloat risk: multipurpose themes, stacked page builders, too many plugins, oversized images, third-party tags… it all adds weight. The Web Almanac’s sustainability chapter even calls out CMS medians—WordPress pages are simply heavier than average today.
Here’s the upside: because most of that weight is optional, you can trim it without gutting your site.
Practical levers (no drama):
- Images: cap dimensions, compress, and serve WebP/AVIF with
srcset. You’ll cut grams and load time instantly. HTTP Archive confirms images are the biggest slice of weight. - Fonts: fewer families/variants; use font-display; consider system fonts for UI text.
- JS diet: remove unused libraries, defer non-critical scripts, consider shipping fewer tracking tags.
- Block theme done right: a modern block theme plus a handful of targeted plugins often beats a giant do-everything stack.
- CDN: edge caching slashes origin transfer and improves global speed.
- Hosting: pick providers with public sustainability statements and efficient infra; cleaner energy lowers grams for the same bytes. SWDM’s 2024 update explains why “per-GB” energy is changing as the network gets more efficient.
You don’t need to be perfect. Just shave the big stuff and re-measure.
How much traffic changes the story
Per view, the grams are small. At scale, they’re not. Here’s a quick way to think about it:
- A blog at 10k views/month at ~0.36 g/view ≈ 3.6 kg/month.
- A publication at 500k views/month at ~0.45 g/view ≈ 225 kg/month.
- A 2M views/month store at ~0.45 g/view ≈ 900 kg/month.
If those numbers feel abstract, remember the context: multiple studies estimate the digital sector at ~3–4% of global emissions, with growth pressures from data and AI. Your WordPress site is a small slice, but it’s a slice you can actually influence this week.
Seasonal note: Q4 spikes, AI summaries, and “egress” surprises
Two 2025 realities worth flagging:
- Traffic spikes (Black Friday, holiday guides, football finals): if your site’s grams per view are high and you triple traffic for a month, your footprint triples too. Cache ahead of time, trim home/PLP templates, and pre-render where possible.
- AI traffic shifts: search experiences that summarise content can change on-site pageviews in either direction depending on your niche. Monitor real traffic, not just averages from last year, and revisit your estimates quarterly.
- Object storage & egress: if you host large assets (video, big downloads) in cloud buckets, egress (data out) is the cost—and the carbon—multiplier. Many teams choose storage/CDN pairs designed to reduce egress penalties (e.g., Cloudflare R2 with “zero egress to Cloudflare CDN”) to keep both money and grams in check.
“Is there a WordPress average footprint I can quote?”
If you want a one-liner that’s defensible and easy to cite:
- The average web page ≈ 0.36 g CO₂e per view (Website Carbon’s public benchmark).
- WordPress pages are typically heavier than the global median (≈2.97 MB vs. ~2.5 MB), so a “typical WordPress view” might be ~0.4–0.5 g unless optimized.
- Heavy media (self-hosted video, large images) can push that far higher; lean builds on clean infra can drop well below 0.1 g.
Is it perfect science? No. Is it responsible, current, and clear for planning and communications? Yes.
Five-minute checklist to lower your grams this week (WordPress edition)
- Measure one page with DevTools > Network. Write down Transferred MB. Cross-check with a page test (PageSpeed Insights or WebPageTest). Compare again in a week.
- Convert hero images to WebP/AVIF. Set real width/height, lazy-load below the fold.
- Cull a plugin you don’t need (especially one that adds heavy JS on every page).
- Use a CDN (turn it on if your host bundles one).
- Limit fonts to one family and two weights for now.
- Move video to a streaming platform or object storage with CDN.
Little wins compound. Your readers feel the speed; the grams fall behind the scenes.
TL;DR planning table (you can copy this)
| Scenario (WordPress) | Page weight (MB) | Monthly pageviews | Per view (g CO₂e)* | Monthly CO₂e |
|---|---|---|---|---|
| Light blog | 1.5 | 10,000 | ~0.22 | ~2.2 kg |
| “Average” web | 2.5 | 50,000 | ~0.36 | ~18 kg |
| Typical WP brochure | 2.97 | 25,000 | ~0.43 | ~10.8 kg |
| Content site / magazine | 3.5 | 150,000 | ~0.50 | ~75 kg |
| WooCommerce store | 3.0 | 300,000 | ~0.43 | ~129 kg |
*Per-view grams scaled from Website Carbon’s 0.36 g average at ~2.5 MB. Your result will be lower with clean hosting, higher with heavier pages.
One last thought
You don’t need perfect data to make good decisions. If your WordPress pages hover around 3 MB and you see 100k+ views a month, you’re likely spending tens of kilograms of CO₂e monthly that you could trim with a weekend’s work—images, fonts, a couple of plugins, a CDN tweak, and smarter hosting choices. It’s not hand-wavy virtue; it’s measurable. And your users will feel the speed the same day you ship the changes.
Related